Posts

Showing posts from November, 2017

Bank Nifty 10th Nov

Image
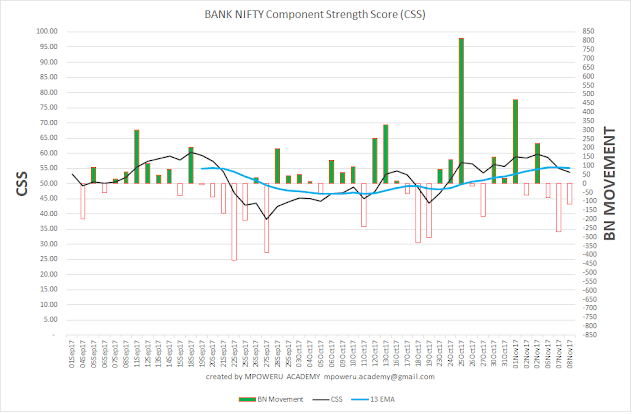
Commentary On Index: Date : 10th Nov Day Stats : A bullish day with a gain of 207 points.   Day: Up Day Candle pattern:   Bullish Candle after a neutral candle confirm trend reversal. Healthy long body with very small lower wick and  small upper wick i.e. opened near the low and closed near the high.  Range: Wide ... indicating demand exceeded supply Volume:  Improved from last two/three days and closer to average (though slightly below average) BANK NIFTY COMPONENT STRENGTH SCORE 10 NOV 17* Component Strength Score : 54.75 EMA : 55.13 Interpretation : Neutral/Sideways. Candle indicating gathering of bullish momentum. *ABOUT COMPONENT STRENGTH SCORE I am experimenting and developing a Component Strength Score based on the study of the underlying constituents of the Index itself. I have started with Bank Nifty. Here is a WIP version. The graph has three data points The movement of BN itself (absolute points), then ...

Nifty 09 Nov 17. Midcaps and PSU Banks gain

Image
Big Picture 09 Nov 2017 Day Stats : A  Bearish day with Close below open.   Day: Up Day with a gain of 5.80 point from previous day close Broad Based Indices: All Green. Top Gainer MidCap50 and MidCap 100 Sectoral Indices: PSU Bank Top Gainer followed by Metals. Top Loser Pharma Advance Decline Ratio : 1.35 (Widespread bullish sentiment) 52W HiLo Score: 73% (Below EMA) 13EMA: 84% Candle Stick Analysis Candle pattern:   Inside bearish candle (though the lower wick reached below the prior candle, the body is fully inside the prior day body). This is a 3rd down day. But because of the inside candle pattern, it does not qualify for the three crows. In a sequence of bearish candles, this candle shows that bears are losing their strength and further consolidation or rally is possible. Range: Wide. No Demand Volume:  Low. Indicates testing or end of supply allowing prices to settle near the mid point of the day's range. Notes: Nifty ...

Bank Nifty 09 Nov 17

Image
Commentary On Index: Date : 09 Nov 17 (Weekly Expiry) Day Stats : Day closed with a gain of 107 points.   Day: Up Day Candle pattern:   Neutral Candle.  Long lower and upper shadow with a very miniscule real body creating a DOJI Pattern after two bearish days.  Indicates potential change in sentiment in upcoming session.   Range: Narrow Volume:  Low Notes: Being weekly expiry low volumes is a surprise. The underlying components are all sideways to bearish. The Doji after two days of fall indicates potential consolidation before further down or up move.   BANK NIFTY COMPONENT STRENGTH SCORE 03 NOV 17* Component Strength Score : 55.72 EMA : 55.19 Interpretation : Neutral. *ABOUT COMPONENT STRENGTH SCORE I am experimenting and developing a Component Strength Score based on the study of the underlying constituents of the Index itself. I have started with Bank Nifty. Here is a WIP version. The graph has t...

Nifty Daily Update 8 Nov 17 Nifty Blues continues

Image
Big Picture 08 Nov 2017 Day Stats : A bearish day with a loss of 47 points.   Day: Down Day 2 days in a row Broad Based Indices: All Red. Top Losers SML100 and MidCap50 Sectoral Indices: Gainers IT, Media and Pharma Top Losers PSU Banks and Metals Advance Decline Ratio : 0.43 (Very Bearish) 52W HiLo Score: 70.59% (Below EMA) 13EMA: 86.55% Candle Stick Analysis Candle pattern:   Very Bearish Big Range Candle 2nd day in a row.  Equal lower and upper shadow Close near the bottom.    Range: Very High. No Demand Volume:  Normal. Supply exceeded Demand Notes: Nifty broke Fib Level 10340 (check my blog with monthly outlook) . heading towards 10235, a 38% retracement. The final target of 10150 would be a 50% retracement which if broken could be a sign of trend reversal. Trend and Momentum Analysis The above chart now has key moving averages plotted as well as the RSI reading. The Index is close to 20 d...

Bank Nifty 08 Nov 17

Image
Commentary On Index: Date : 08 Nov 17 Day Stats : A bearish day with a loss of  116.45 points.   Day: Down Day Candle pattern:   Bearish Candle.  Equal upper and lower shadow.  Close near the bottom Range: Wide Volume:  Low  BANK NIFTY COMPONENT STRENGTH SCORE 03 NOV 17* Component Strength Score : 53.85 EMA : 55.11 Interpretation : Neutral *ABOUT COMPONENT STRENGTH SCORE I am experimenting and developing a Component Strength Score based on the study of the underlying constituents of the Index itself. I have started with Bank Nifty. Here is a WIP version. The graph has three data points The movement of BN itself (absolute points), then there is a Component strength (CSS) raw score overlaid with an EMA of the CSS. How to read the Component strength score (CSS) A score of 50 is neutral A score between 51 and 60 is neutral with bullish bias A score above 60 indicates strength in the rally A score be...

Nifty 07 Nov 2017. Nifty kisses 10340

Image
Big Picture 07 Nov 2017 Day Stats : A bearish day with a loss 101.65 points.   Day: Down Day Broad Based Indices: All Red. Top Losers MidCap50 and SML100 Sectoral Indices: Sole Gainer IT 2.22% Rest in red. Top Loser PSU Banks Advance Decline Ratio : 0.31 (Very Bearish) 52W HiLo Score: 83% (Below EMA) 13EMA: 88.27% Candle Stick Analysis Candle pattern:   Very Bearish Big Range Candle.  Small lower shadow and upper shadow. Close near the bottom.    Range: Very High. No Demand Volume:  Normal. Supply exceeded Demand Notes: Nifty found support at Fib Level 10340 (check my blog with monthly outlook) . This is a 23% retracement. A 23% retracement is a healthy sign as Nifty is at lifetime high levels and a bounce back from these levels can take it to the second upside target post breaking 10500. Further bearish move could take it 10235. Trend and Momentum Analysis The above chart now has key moving averages plotte...

Bank Nifty 07 Nov 17

Image
Commentary On Index: Date: 07 Nov 17 Day Stats : A full bearish candle with a loss of 270.35 points.   Day: Down Day Candle pattern:   Triple top based on High of the day.  BN has attempted to break 25696 thrice in as many days. Today, the price rejection was massive. Short upper and lower shadows indicating dominance of supply. Wide range indicates lack of buyers at higher levels.    Range: Wide Volume:  Low       BANK NIFTY COMPONENT STRENGTH SCORE 03 NOV 17* Component Strength Score : 55.31 EMA : 55.07 Interpretation : Neutral. EMA has started falling. Another day of EMA fall would indicate reversal of bullish bias.  BN AT A GLANCE *ABOUT COMPONENT STRENGTH SCORE I am experimenting and developing a Component Strength Score based on the study of the underlying constituents of the Index itself. I have started with Bank Nifty. Here is a WIP version. The graph has three data ...

Nifty Daily Update 06 Nov 17. Deuce despite another all time high

Image
Big Picture 06 Nov 2017 In tennis, when both players are at equal score of 40 all, it is called deuce and then the first player to win two consecutive points wins that game. Nifty closed level to the Friday closing. While Nifty opened lower, buying was witnessed during the day helping the Nifty to close at 10451.80 almost same as Friday's close. The bears failed to sustain the lower levels and the bulls failed to sustain the higher levels but managed to close mid way. So, in a way, the Bulls managed to draw (in tennis parlance) the session today after being down. The day witnessed a new life time high of 10490.45.  The broad market indices (except Nifty) were positive with Nifty Next 50 being the top gainer. Auto and PSU banks lead the sectoral indices while  Private Banks, Bank Nifty and Fin Services all ended in red. Pharma was the only other loser. The advance decline ratio was neutral at 0.97  while the 52W HiLO Score was 87.76% (versus an 13 EMA of 88.19). T...

BANKNIFTY 06 Nov 17

Image
Commentary On Index: Day Stats : A bearish day with a loss of ~80 points.   Day: Down Day Candle pattern:   Bearish Candle.  Gravestone Doji near the top (Reversal sign) Range: Narrow Volume:  Very Low BANK NIFTY COMPONENT STRENGTH SCORE 03 NOV 17* Component Strength Score : 58.59 EMA : 55.35 Interpretation : Neutral with bullish momentum BANK NIFTY AT A GLANCE *ABOUT COMPONENT STRENGTH SCORE I am experimenting and developing a Component Strength Score based on the study of the underlying constituents of the Index itself. I have started with Bank Nifty. Here is a WIP version. The graph has three data points The movement of BN itself (absolute points), then there is a Component strength (CSS) raw score overlaid with an EMA of the CSS. How to read the Component strength score (CSS) A score of 50 is neutral A score between 51 and 60 is neutral with bullish bias A score above 60 indicates strength in the rally A sc...

Nifty: Daily, Weekly and Oct Monthly Analysis. 03 Nov 2017

Image
Combined Chart Nifty : Daily, Weekly, Monthly Chart on the left side is the monthly chart along with the Fib extension for targets. The top right corner is Daily Chart. The bottom right is Weekly Chart. Now the analysis follows. Daily Analysis Refer the top right chart for the daily candle. The Friday candle has formed a near perfect hanging man on the daily chart at the peak. The Long Lower shadow and a small body at the top indicates resistance at higher price levels. The location at the top makes this a strong reversal sign. Volume is low which dilutes the strength of the reversal sign.  Longer time frame charts weekly and monthly are bullish with momentum. The daily chart outlook is neutral (reversal candle). Weekly Analysis Refer the bottom right chart for the weekly chart. A Weekly candle is a  bullish candle with small upper and lower wicks. The close is a lifetime high weekly close for the Nifty.  The range is nor...

BANK NIFTY 03 Nov 2017

Image
Commentary On Index: Day Stats : A bullish day with a gain of 223.40 points.   Day: Up Day Candle pattern:   Bullish Candle.  Long lower shadow with a close near the top.   Range: Normal Volume:  Normal BANK NIFTY COMPONENT STRENGTH SCORE 03 NOV 17* Component Strength Score : 59.62 EMA : 54.82 Intepretation : Neutral with bullish momentum Bank Nifty Components sorted in order of bullishness *ABOUT COMPONENT STRENGTH SCORE I am experimenting and developing a Component Strength Score based on the study of the underlying constituents of the Index itself. I have started with Bank Nifty. Here is a WIP version. The graph has three data points The movement of BN itself (absolute points), then there is a Component strength (CSS) raw score overlaid with an EMA of the CSS. How to read the Component strength score (CSS) A score of 50 is neutral A score between 51 and 60 is neutral with bullish bias A score above 60 indi...

Nifty Daily Update 2 Nov 2017. Market consolidates on Weekly Expiry Day

Image
Big Picture 2 Nov 2017 A day with low volumes, narrow range and a loss of 16 points after ascending the summit is like a mountaineer taking rest after hoisting his flag at the summit and before (s)he begins the journey to conquer the next peak. Nifty closed at 10423.80, lower than yesterday but comfortably above the 10400 psychological mark. The broad market indices were positive with Nifty 50, Nifty 100 and Nifty 200 also ending the day in red. Small caps was  the top gainer. Amongst the sectors, Pharma broke out today with a gain of 3% while PSU Banks and Auto were top losers. Sectoral indices presented a mixed picture. The advance decline ratio was neutral at 0.96 while the 52W HiLO Score was 90.35% (versus an 13 EMA of 86.28). Candle Stick Analysis Nifty formed a Bearish Neutral Candle. An small lower wick and a small upper wick and small body indicated low activity levels in the market. Neutral candle consolidating after a rise. Volumes were b...

BankNifty Component Strength Score 2 Nov 17

Image
BANK NIFTY COMPONENT STRENGTH SCORE 02 NOV 17* Component Strength Score : 58.38 EMA : 54.04 Intepretation : Neutral with bullish momentum Commentary: Day Stats : A day of consolidation noted. A bearish inverted hammer at the peak would be bearish. Considering it is weekly expiry, low volumes and below average range, the interpretation is consolidation with more upswing to come. Tomorrow will provide a clear indication as the session today gives a good stop loss for the bears.  Day: Down Day Candle pattern:   Bearish Candle. Inverted Hammer at the peak.  Small lower shadow and long upper shadow indicating selling pressure and close near the low of the day.  Range: Narrow Volume:   Low *ABOUT COMPONENT STRENGTH SCORE I am experimenting and developing a Component Strength Score based on the study of the underlying constituents of the Index itself. I have started with Bank Nifty. Here is a WIP version. The graph has three data ...